
Introduction
In 2015, the Paris Climate Accords committed countries around the world to limit global warming to well below 2°C, and ideally to 1.5°C. Although the intervening eight years have seen increased ambition in climate pledges and significant deployment of clean energy technologies, progress has been far from sufficient.
As highlighted by the latest UN Environment Programme Emissions Gap Report, emissions are still rising and the gap to a 1.5°C-aligned pathway remains vast:
- Global greenhouse gas emissions in 2022 reached around 57 GtCO2e, of which roughly 43 GtCO2e came from the emission of carbon dioxide, 11 GtCO2e came from the emission of methane,1Assuming a GWP-100 value of 30 for methane. This value is used for all calculations of CO2-equivalent for methane emissions mitigation by 2030. and the remainder from other greenhouse gases, mainly nitrous oxides and F-gases.
- By 2030, on current policy trajectories, global emissions would still be at around 56 GtCO2e – a shade below the level today.
- To be on track for a 1.5°C pathway, the latest science from the IPCC suggests emissions in 2030 would need to be around 33 GtCO2e. Within this, around 20–23 GtCO2e would be from carbon dioxide and another 7-8 GtCO2e would be from methane.
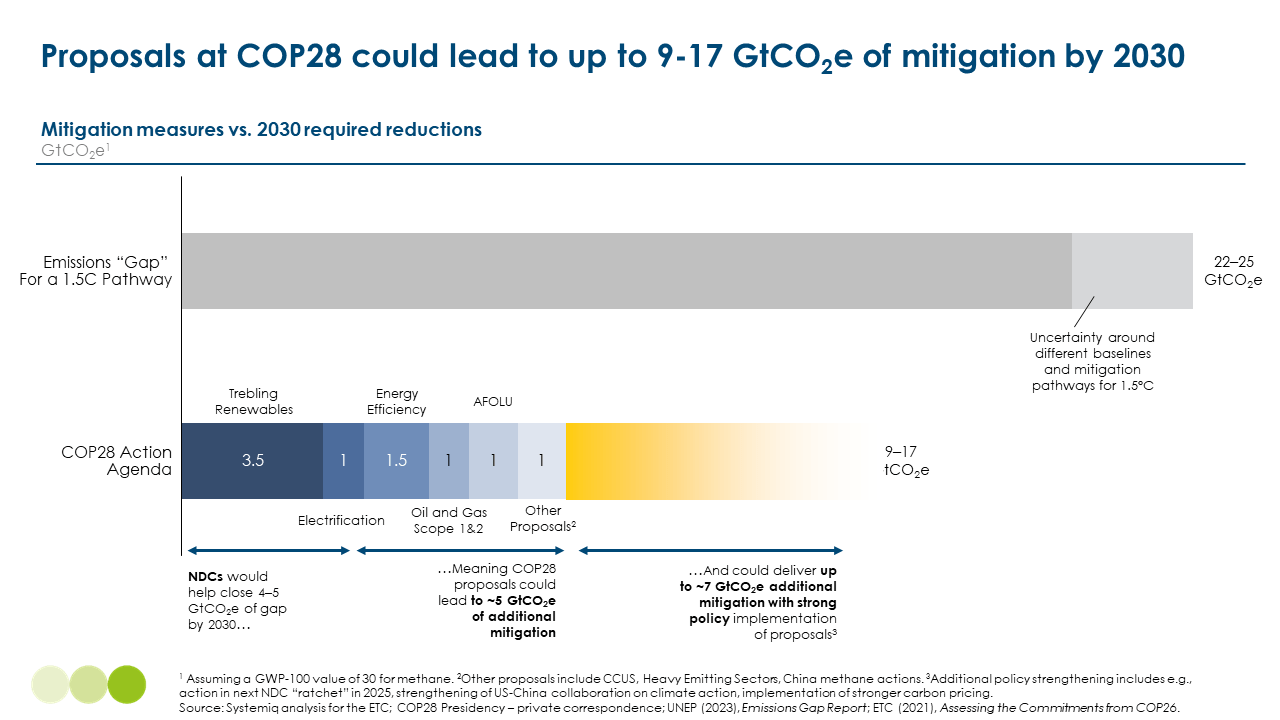
- The “Emissions Gap” therefore, after accounting for some uncertainty in estimates, amounts to around 22–25 GtCO2e of emissions that need to be mitigated by 2030 to be on track for a 1.5°C pathway.2The values are based on the gap of 21–24 GtCO2e between unconditional NDCs and a 1.5°C pathway, together with approximately 1 GtCO2e gap between a baseline pathway and unconditional NDCs.
Existing pledges and actions included in country Nationally Determined Contributions (NDCs) – which have been largely unchanged since COP26 – could lead to around 4–5 GtCO2e of emissions reductions in 2030,3This is based on estimates of 2030 emissions under different scenarios in UNEP (2023), Emissions Gap Report; UNFCCC (2023), NDC Synthesis Report. helping to close the gap somewhat – but leaving much further to go. This makes action at COP28, and especially the next round of updates to NDCs in 2025, vital to lock in progress in the remaining half of the 2020s.
The ETC estimates that proposals at COP28 (the “Action Agenda”) could lead to between 9–17 GtCO2e of mitigation by 2030, i.e. 5–12 GtCO2e of additional mitigation beyond existing NDCs – and would put fossil fuel demand on a declining pathway. The lower end of this range is similar to the estimates the ETC had for actions put forward at COP26, highlighting the need for increasing ambition and implementation.
For the world to have any chance of closing the gap towards 1.5°C:
- Signatories to these pledges should continue to expand.
- Signatories should ensure that the ambition translates into action in their home countries.
- The next round of country NDC submissions (in 2025) should reflect this increased level of ambition on mitigation, from trebling renewables to shifting the food system, and include the policy and financing packages needed to deliver this by 2030.
How much of the emissions gap can the Action Agenda close by 2030?
COP28 has seen a wide range of proposals put forward. The key ones that the ETC believes can lead to significant mitigation by 2030 are:
- Trebling Renewables: increasing global installed renewables capacity from around 3.5 TW in 2022, up to around 11 TW by 2030.4Renewables includes wind and solar, as well as hydropower, geothermal and bioenergy.
- Energy Efficiency: doubling annual primary energy efficiency gains from ~2% p.a. up to ~4% p.a. through to 2030.
- Oil and Gas: Achieving near-zero methane and zero routine flaring by 2030.
- Carbon Capture: An aspirational goal for gigatonne-scale carbon capture capacity by 2030.
- Heavy Emitting Sectors: Launch of the Industrial Transition Accelerator (ITA) to increase low-carbon supply and accelerate demand for green products.
- Deforestation: Protect, restore and sustainably manage forest basins in key tropical countries, helping to stop global deforestation.
- Food Systems: A range of proposals to accelerate the uptake of alternative proteins, fertiliser innovations, dietary shifts, and reductions in agricultural methane emissions.
Below we explain where this action can happen and what is required to achieve it fully.
For each proposal, we provide:
- A “Prudent” estimate of mitigation by 2030, based on current trends in deployment of clean energy technologies, project pipelines, and feasibility of mitigation solutions.
- A “Maximum” estimate of mitigation by 2030, assuming that all countries sign up to proposals, that these are reflected in 2025 NDC submissions, and are supported by strong policy action to support full implementation by 2030.
Renewables
Prudent Estimate: Around 3.5 GtCO2e
Maximum Estimate: Around 4 GtCO2e
Global installed capacity of wind and solar stood at around 900 GW and 1,200 GW, respectively, in 2022. This was complemented by another 1,400 GW of hydropower, and much lower levels of geothermal and bioenergy-based generation.
Although exact pathways vary, overall the aim to treble renewables by 2030 would rely on an approximate trebling of global wind capacity, a five-fold increase of global solar capacity, and some growth in hydropower and geothermal by 2030 – leading to an increase from around 3,500 GW of installed capacity in 2022, up to close to 11,000 GW by 2030. Annual installations of wind and solar would need to rise to over 1,000 GW each year by 2030.5This depends strongly on pathway taken to reach a trebling of capacity, and the split between wind and solar: BNEF’s Net Zero scenario reaches around 1,200 GW p.a. of additions in 2030; IRENA estimates around 975 GW p.a.; Ember estimate up to 1,500 GW p.a. If fully achieved, this renewables uptake could displace significant amounts of coal, and also some gas and oil used in power generation – leading to around 4 GtCO2e of mitigation.
Importantly, this global target masks significant country-specific variation – countries with high existing renewables deployment will likely not need to treble capacity; countries with rapidly growing power demand could need to do much more:
- Europe will likely fall short of a trebling of renewables capacity by 2030 – but given fairly high levels of existing renewables deployment, a trebling might not be required for a 1.5°C-aligned pathway.6Renewables are expected to roughly double by 2030, from around 660 GW up to 1,300 GW. Renewables generation made up around 33% of electricity in 2022, with nuclear power contributing a further 20%. BNEF (2023), Tripling Global Renewables by 2030; BNEF (2023), Interactive Data Tool – Capacity.
- Even though not a signatory, China is currently expected to treble renewables capacity by 2030, from around 1,200 GW of wind, solar and hydropower, up to around 3,700 GW by 2030.7This includes a six-fold increase in solar capacity, from ~440 GW in 2022 up to over 2,500 GW in 2030, and a 2.5x increase of wind capacity from ~390 GW in 2022 up to 930 GW in 2030. BNEF (2023), Tripling Global Renewables by 2030; BNEF (2023), Interactive Data Tool – Capacity.
- Similarly, India (another non-signatory) is expected to come close to a trebling of renewables by hitting 500 GW of non-fossil fuel power generation – and could go further.8Renewable capacity in India is expected to increase from around 160 GW in 2022, up to 510 GW by 2030. Importantly, the 500 GW target is currently not reflected in India’s NDC. Ember (2023), Tracking National Ambition Towards a Global Tripling of Renewables.
- Indonesia, which also did not sign up, has rapidly rising power demand and could go well beyond tripling renewables by 2030 – BNEF estimate that an 8-fold increase could be needed by 2030 – but current wind and solar pipelines fall well short of this.9Current forecasts expect a slight growth of renewables, from 13 GW in 2022, up to around 22 GW by 2030 – mainly due to a lack of support for renewables and very cheap coal power generation. BNEF (2023), Tripling Global Renewables by 2030; BNEF (2023), Indonesia’s $20 Billion Climate Plan Lets Coal Off the Hook.
Analysis by both Ember and BNEF provides more detail around the national implications of the global pledge. All countries should reflect increased ambition on renewables, especially wind and solar, in their updated NDCs for 2025. Making long-term plans to increase nuclear capacity, in line with the pledge to treble capacity by 2050, can also help drive additional decarbonisation – but likely only well beyond 2030.
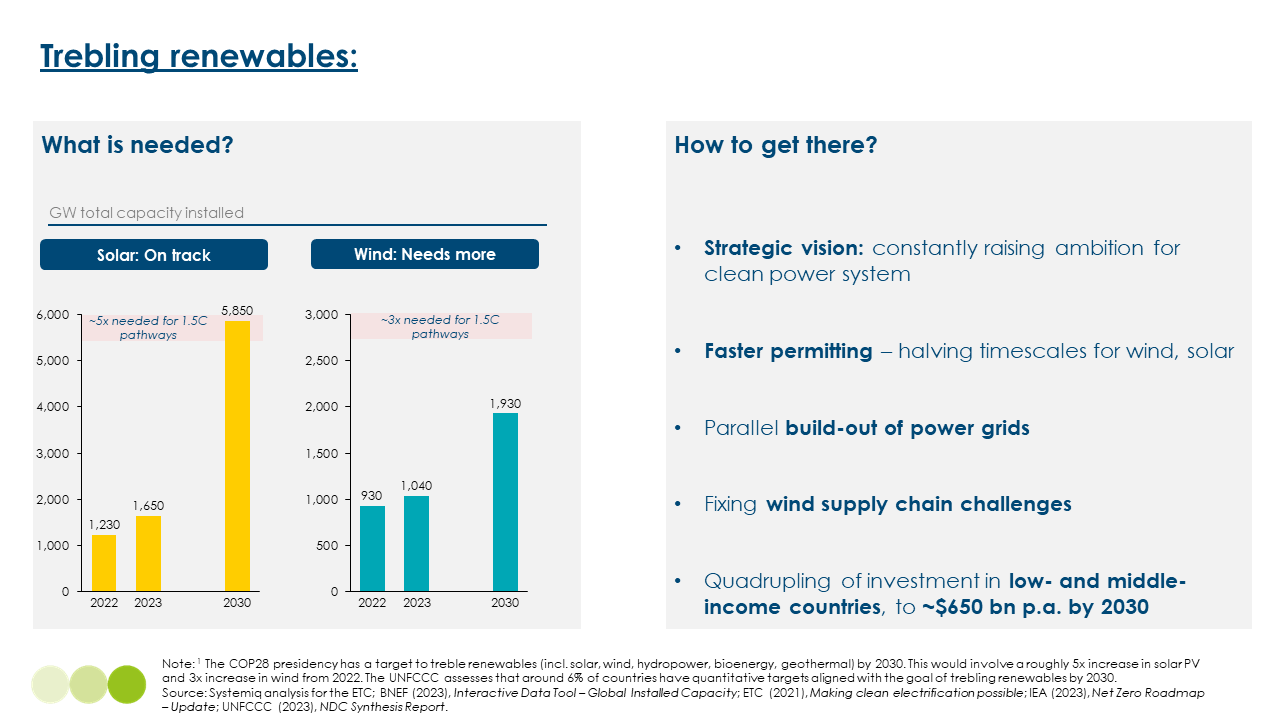
Current solar project pipelines are on track for 2030 targets: BNEF estimate over 5,850 GW of capacity by 2030. However, wind project pipelines are far off track and estimated to only double by 2030 to around 1,900 GW – leaving a significant gap, and contributing to a reduction of our estimated potential for mitigation to around 3.5 GtCO2e.10Given much higher average capacity factors for wind power, and the strong complementarity between wind and solar generation, this gap in capacity by 2030 should not be closed purely by additional solar installations.
The success of the trebling target therefore relies on both ensuring that existing pipelines are built on time and that additional projects can be added quickly. Five measures are crucial to achieve this:
- A strong strategic vision – constantly raising ambition for national targets, ideally reflected in updated NDCs.
- Faster permitting – the ETC estimates timescales for wind and solar projects can be halved in many developed countries, with a strong need to engage local communities.
- A parallel build-out of power grids – including anticipatory investment and strategic planning for smarter, more distributed grids.
- Fixing wind supply chain challenges – although we believe most issues faced by the wind industry recently are temporary, simple measures can provide additional confidence to ensure that more wind projects can go ahead profitably.
- A four-fold increase in investment in power generation and grids in low- and middle-income countries, to around $650 bn p.a. by the late 2020s.
Energy Efficiency
Prudent Estimate: Around 2.5 GtCO2e
Maximum Estimate: Up to 5 GtCO2e
Doubling energy efficiency improvements can significantly reduce future growth in energy demand, helping to reduce demand for fossil fuels and associated emissions. The IEA’s recent Net Zero Roadmap update explicitly modelled a doubling of annual energy efficiency improvements from 2% each year, rising to 4% each year. If fully achieved, the IEA estimates this could avoid around 100 EJ of global primary energy demand. After accounting for displaced fossil fuel demand from renewables, we estimate around 80 EJ of fossil fuel demand could be avoided, reducing emissions by around 5 GtCO2e.
This would require strong progress in four key areas:
- Electrification: Shifting from combustion to electrified technologies such as renewable power generation, electric vehicles or heat pumps significantly increases efficiency, reducing primary energy demand whilst providing the same (or more) useful energy.
- Clean Cooking: significantly shifting away from highly inefficient, polluting biomass-based cooking can reduce emissions and air pollution and also decrease energy demand due to more efficient cookstoves.
- Technical Efficiency: Increasing the average efficiency of air conditioners, combustion cars, fridges and other appliances can significantly help reduce energy demand. In most countries, this needs to be driven by increased adoption of standards and regulation to improve the performance of available technologies. Increasing the efficiency of industrial processes, i.e. the amount of energy used to produce every tonne of steel, cement or ammonia, is also crucial to reduce industrial energy demand.
- Avoided Demand and Behaviour Changes: This requires changes in mobility patterns, including shifts from cars to public transport and from planes to trains, alongside more moderate temperatures for heating (19–20°C) and cooling (24–25°C), and the introduction of 100 km/h speed limits on motorways.
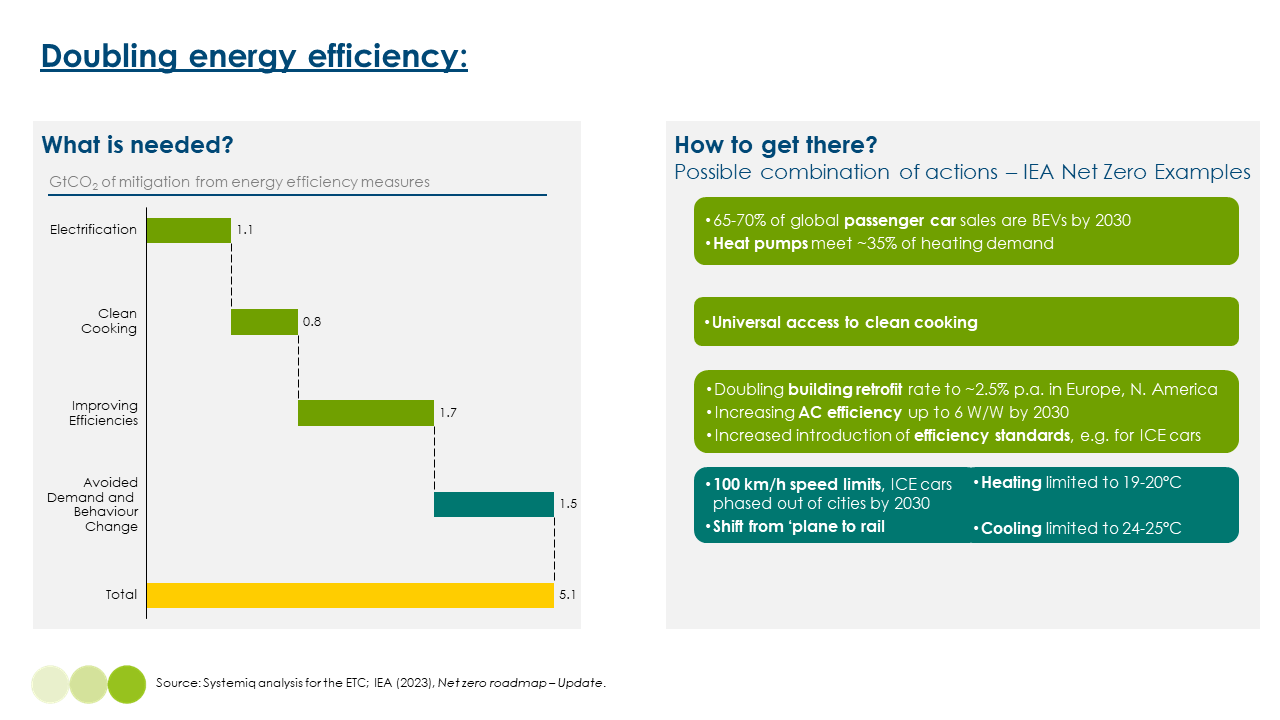
Some of these measures are already taking place: electric vehicle uptake continues to exceed expectations, and heat pump deployment is accelerating rapidly in certain European countries. However, deployment can go faster, and increased policy and societal action will be needed to achieve strong action on technical efficiency and behaviour changes. This leads us to reduce our estimated potential mitigation to 2.5 GtCO2e.
Oil and Gas
Prudent Estimate: Around 1 GtCO2e
Maximum Estimate: Up to 2 GtCO2e
Proposals at COP28 focus on Scope 1 & 2 emissions from the oil and gas industry, with a target to reduce methane-related emissions to near-zero by 2030 (as well as long-term net zero Scope 1 & 2 targets for 2050). Currently, Scope 1 & 2 emissions from the oil and gas industry amount to over 5 GtCO2e, split roughly half-half between methane and carbon dioxide.
If 75% of the industry achieves >95% reductions in methane-related emissions by 2030, we estimate that this could achieve a reduction of around 2 GtCO2e by 2030. If just 40% of the industry implements the target, the current coverage by signatories, this would fall to around half that value.
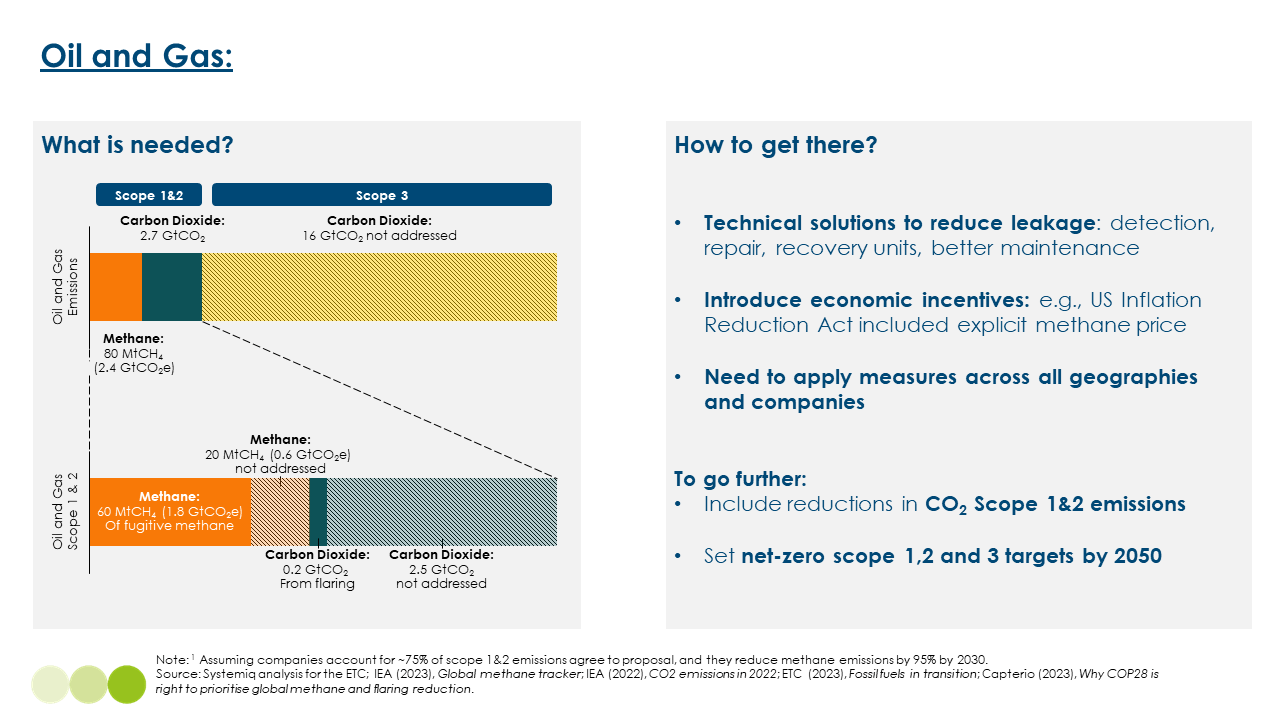
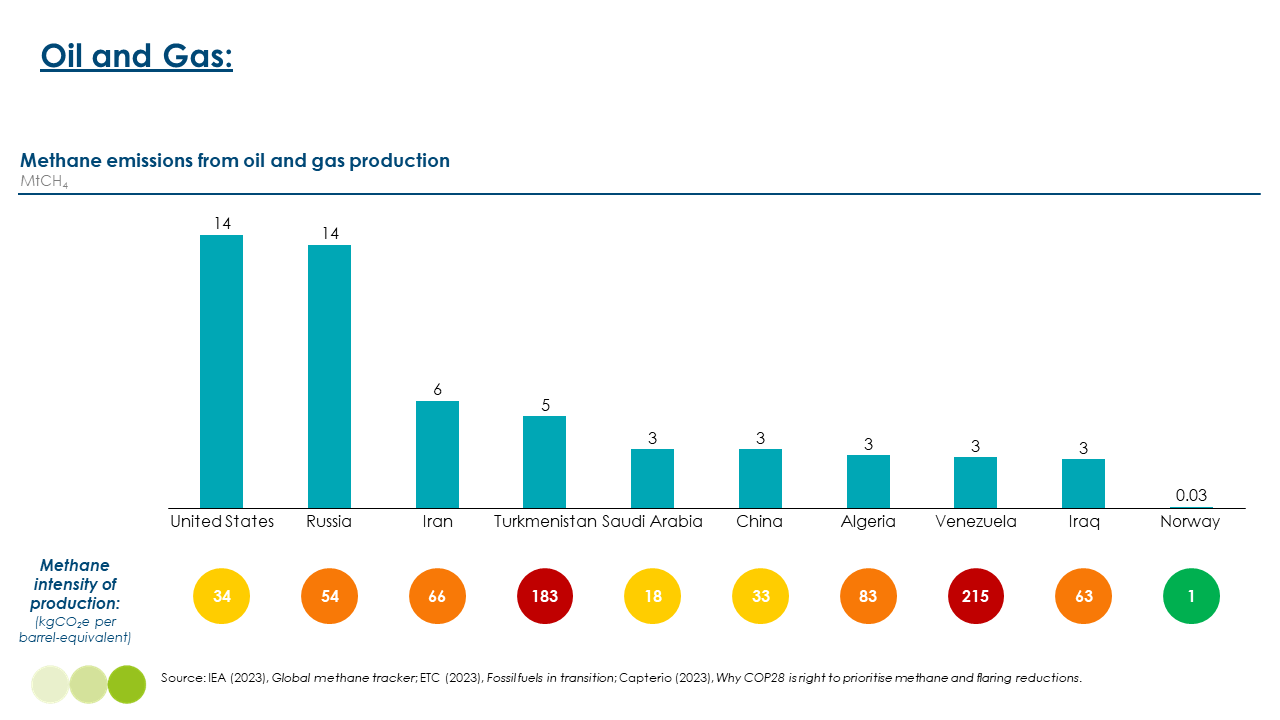
Crucially, reducing methane emissions relies on very strong implementation by both individual companies and countries. Pledges to reduce methane emissions have been announced before, and the IEA estimates that around half of methane emissions could be abated at zero or negative cost. Unfortunately, real-world reductions have been lacking, and around half of oil and gas methane emissions come from countries not signed up to the Global Methane Pledge. Ensuring strong action in countries with high methane emissions (e.g., the USA and Russia) and high methane intensity of production (e.g., Venezuela, Turkmenistan) will be crucial to ensure success – the initial list of signatories is promising, but does not include some of these countries and their national oil companies.
Carbon Capture
Prudent Estimate: 0.4 GtCO2e
Maximum Estimate: Around 1 GtCO2e
Progress in deployment of carbon capture and storage at scale remains stalled, with current global capacity of around 50 MtCO2. Announced project pipelines have grown recently, especially in response to tax credits available in the US via the Inflation Reduction Act, and could lead to 400 MtCO2 of carbon capture capacity by 2030.
Achieving this project pipeline will be challenging, requiring a quadrupling of growth rates to 2030, against what has been seen in the past few decades. Hitting the target of gigatonne-scale capacity by 2030, as part of the Carbon Management Challenge, would need around 45% annual growth rates each year to 2030 – a seven-fold increase in deployment rate.
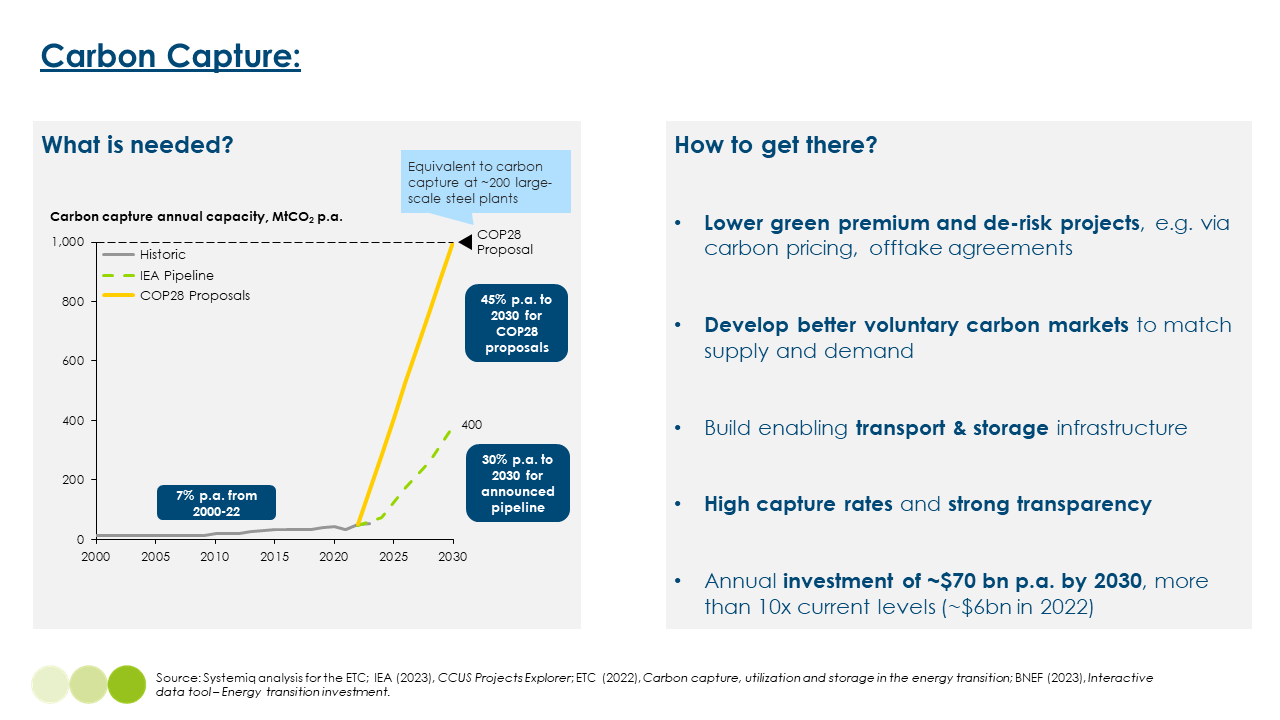
Existing projects have faced challenges including high costs and low capture rates – such as the Gorgon project in Australia – and these will need to be resolved to ensure both successful project build-out and to provide trust and confidence in the deployment of this technology.
More broadly, projects need to be de-risked through carbon pricing and offtake agreements, investments need to rise ten-fold from current levels, and significant enabling transport and storage infrastructure for CO2 will also need to be built.
Importantly, deployment of carbon capture at scale will help reduce emissions in the medium- to long-term, but will not mean business-as-usual for the fossil fuel industry. A range of affordable clean energy technologies is already available that can replace fossil fuel use now and in coming decades, with carbon capture deployment in 2050 potentially covering at most 10-15% of current fossil fuel demand.
Heavy Emitting Sectors
Prudent Estimate: Around 250 MtCO2e
Maximum Estimate: Up to 600 MtCO2e
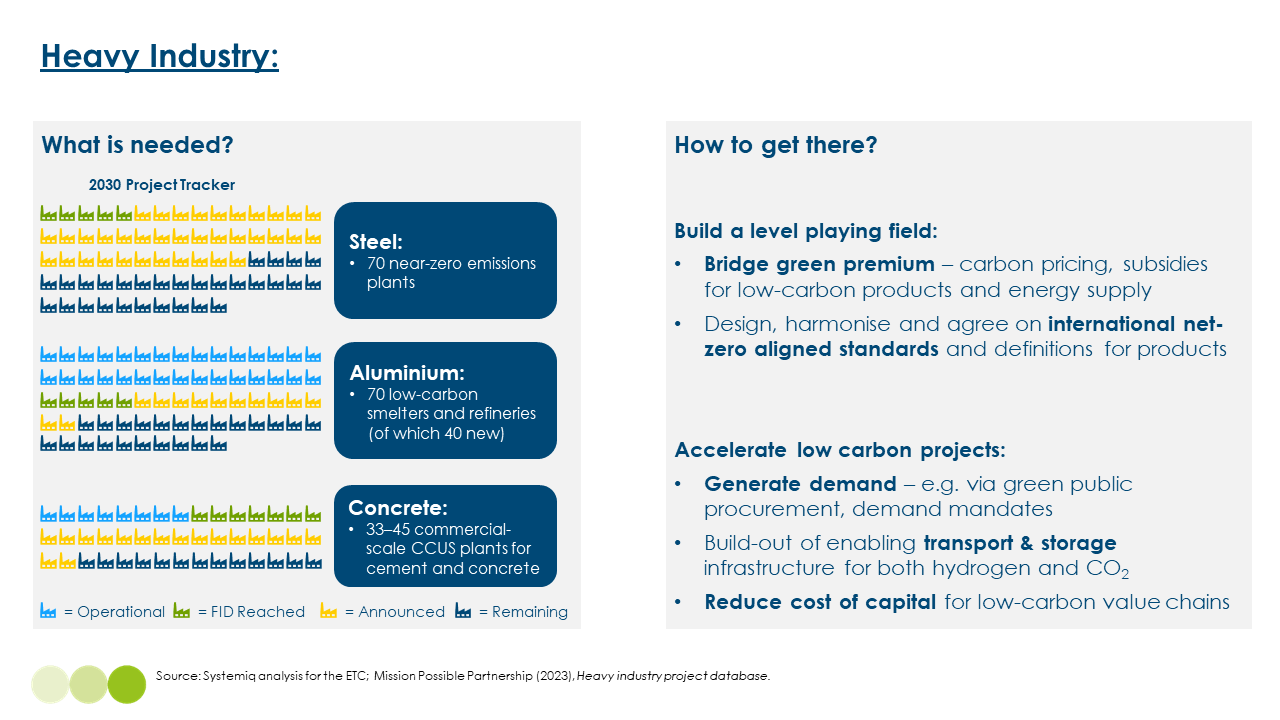
The Industrial Transition Accelerator was launched at COP28 to drive decarbonisation of key sectors including steel, cement, aluminium, shipping and aviation – chiefly by increasing demand for green products and building out their respective clean supply chains.
Based on the Mission Possible Partnership’s sectoral transition strategies, we estimate that by 2030, action on steel, cement, aluminium, aviation and shipping could lead to around 600 MtCO2e of emissions reductions.11This excludes potential mitigation using carbon capture in these sectors, which is accounted for in the carbon capture mitigation totals. Although this amount of mitigation is not hugely significant by 2030, it would put these sectors on a clear pathway for ambitious mitigation in the 2030s and beyond.
However, too many projects remain stalled without reaching final investment decisions and low-carbon products still have too large a green premium to make significant inroads. This explains the significant gap between current project announcements and what is required to be on track for each sector, according to the Mission Possible Partnership.
Two key actions needed to accelerate this sector are:
- Building a level playing field, by bridging the green premium (e.g., via carbon pricing) and agreeing on international net-zero aligned standards and definitions for products.
- Accelerating low-carbon projects, by generating advanced demand (e.g., through public procurement and demand mandates) and ensuring that adequate low-carbon hydrogen and carbon capture infrastructure is available.
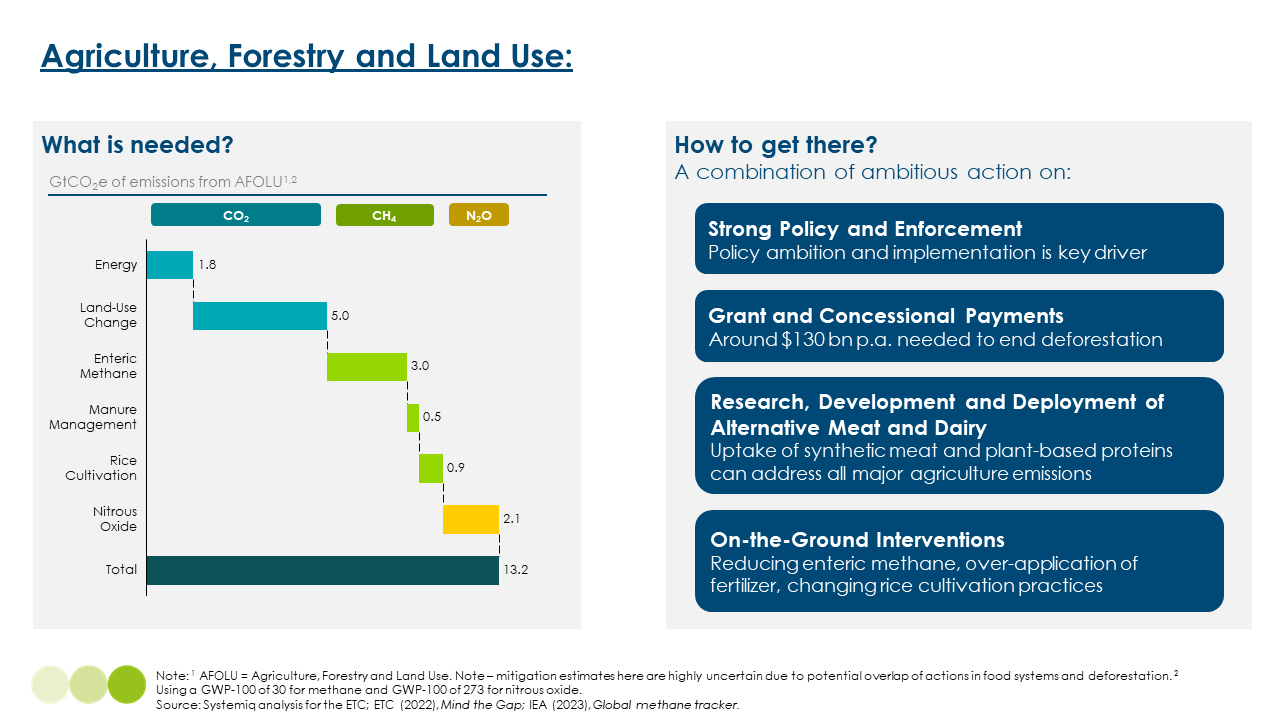
Deforestation, Agriculture and Food Systems
Prudent Estimate: Around 1 GtCO2e
Maximum Estimate: Up to 4 GtCO2e
Addressing emissions in this area requires strong action on two strongly linked areas: deforestation and land-use change, which currently contributes around 5 GtCO2 p.a. of net emissions, and the agriculture and food system, which in many cases is a key driver of this land-use change.
For deforestation, the forest country finance packages put forward at COP28 to help end deforestation are promising, including finance for Papua New Guinea, the Democratic Republic of the Congo, Ghana, Republic of Congo and Indonesia. These packages are meant to build on the Glasgow Declaration on Forests and Land Use, and the Forest & Climate Leaders’ Partnership.
However, pledges to end deforestation have also been announced before with little follow-through, and progress in recent years has been negligible, both in terms of on-the-ground implementation and provision of financial flows to support action – with the exception of Brazil, where deforestation rates have fallen significantly in the past year.
The ETC estimates that around $130bn of annual grant or concessional payments could be needed to end deforestation – this compares with just $2.3 bn of annual domestic and international finance for forest mitigation prior to COP28.12ETC (2023), Financing the Transition: Supplementary Report on the Costs of Avoiding Deforestation. The hundreds of millions announced at COP28 are orders of magnitude below what is required – although Brazil put forward suggestions for a $250 bn Tropical Forests Forever fund at COP28.
Taking an estimate of mitigation potential from deforestation reductions from a comprehensive academic study, covering Brazil and the countries with finance packages above, gives a potential estimate of 1–2 GtCO2e of mitigation by 2030. We take the upper end as our “Maximum” estimate, but given the very low levels of finance put forward, we scale down the lower end to around 0.5 GtCO2e for our “Prudent” estimate.
Announcements around the Food System are welcome, with the sector receiving significant attention at COP28 – hopefully the start of a journey on a path to net-zero emissions by mid-century.
The ETC estimates that increasing the uptake of alternative proteins and plant-based dairy to reach ~10% of global markets by 2030 could achieve 0.5-1 GtCO2e of mitigation, whilst other measures including reductions in food waste, decarbonisation of ammonia production, lower over-application of fertilisers and increased productivity could achieve up to 1 GtCO2e of further mitigation. Importantly, increasing uptake of alternative proteins and plant-based dairy has significant overlap with efforts to reduce deforestation and land-use change over the long term – overlap which we have attempted to account for in this analysis.
Measures in the food system include significant potential action on methane emissions, which could be reduced by around 20% by 2030 in this sector, including through reductions in enteric fermentation and methane emissions from rice farming – on the latter, the recent announcement of action by China is promising, pending additional detail in future NDC submissions.
What could it all add up to?
When put together, the proposals here could add up to significant action: up to 17 GtCO2e of mitigation by 2030 if fully implemented, of which approximately 14 GtCO2e would be from carbon dioxide emissions and a further 3 GtCO2e would be from methane.13Note that, as mentioned above, NDCs submitted by September 2023 would achieve 4–5 GtCO2e of mitigation by 2030. UNEP (2023), Emissions Gap Report. Achieving the full 17 GtCO2e would need very strong additional policy action (e.g., speed limits on motorways, taxation on heavier SUV cars, strong investment and policies to encourage alternative proteins and dairy), covering substantially more ambitious NDCs submitted in 2025, as well as a suite of other measures to accelerate clean energy technology deployment and emissions mitigation.
However, given the challenges highlighted above for each sector, the ETC believes that a more reasonable estimate of likely mitigation for 2030 is around 9 GtCO2e by 2030 – and would still require strong efforts to achieve this progress, including accelerated permitting regimes for renewables, phase-out dates for gas boilers and more.
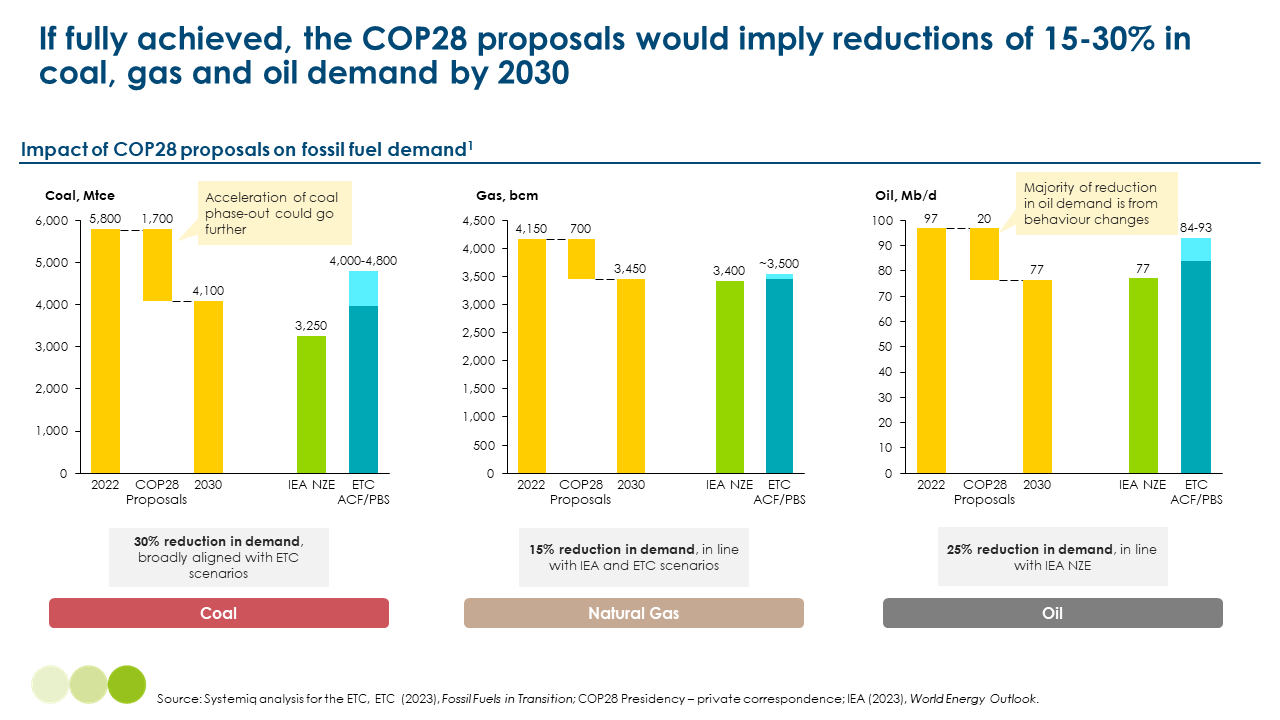
The implication of achieving these measures fully (i.e., reaching 17 GtCO2e of mitigation) with respect to fossil fuel demand by 2030 is significant and worth highlighting:
- Demand for coal could fall by 30% as trebling renewables helps rapidly displace coal in the power system.
- Renewables deployment and electrification of heat help drive down gas demand by 15%.
- Electrification of transport and behaviour change would drive a significant 20% decrease in oil demand.
Overall, these measures would bring demand in line with IEA and ETC scenarios for decarbonisation by mid-century – making strong progress on phasing down fossil fuels.
In sum, it is fair to argue that COP28 has put forward ambitious action that, on paper and only if all countries fully implemented, could significantly close the gap to a 1.5°C pathway in 2030. If fully implemented, these proposals would be a step on from announcements at COP26 and should contribute to increased ambitions in the global stocktake text at COP28.
However, if these proposals are not turned into national-level targets, policies and deployment – especially in the 2025 NDC ratchet – then this action agenda will remain only on paper.
Delivery is key.
Detailed Assumptions
| Sector | Ambition | “Prudent” Estimate Assumptions | Mitigation Estimate |
| Renewables | Treble total installed renewables1 capacity from ~3.5 TW up to ~11 TW by 2030 |
|
4 GtCO2e |
| Energy Efficiency | Double annual primary energy efficiency gains from ~2% p.a. up to ~4% p.a. by 2030 |
|
5 GtCO2e |
| Oil and Gas | Net Zero Scope 1&2 emissions by 2050, near-zero methane and zero routine flaring by 2030. | 75% of oil and gas industry emissions are covered, with companies reducing methane-related emissions (~80 MtCH4 and ~250 MtCO2 from flaring in 2022) by 95% by 2030. | 2 GtCO2e |
| CCS | Aspirational goal for Gt-scale CCS by 2030 | Assume full ambition of ~1,000 MtCO2 capacity by 2030 gets built – very stretching | 1 GtCO2e |
| Heavy Emitting Sectors | Launch ITA for cement, steel, aluminium, shipping, aviation | Mitigation by 2030 in line with Mission Possible Partnership’s Sector Transition Strategies for steel, cement, aluminium, shipping, aviation. This requires: ~70 near-zero steel plants; ~40 new low-carbon aluminium smelters and refineries; 33–45 commercial-scale CCUS cement plants; ~200 zero-emission fuelled ships; ~300 sustainable aviation fuel plants. | 0.6 GtCO2e |
| Deforestation | Protect, restore and sustainably manage forest basins in a range of tropical countries | Take average mitigation potential from deforestation measures included in Roe et al. (2021) for four key example countries: Brasil, Indonesia, PNG, Ghana, DRC, RoC. Assume that policy and/or financial mechanisms scale substantially to deliver this.
|
2 GtCO2e |
| Agriculture and Food | Range of proposals to accelerate uptake of alternative proteins, fertilizer innovations, dietary shifts, and reductions in agriculture methane emissions |
|
2 GtCO2e |
| China Methane | Pledge to include methane mitigation in next NDC | Assume China implements measures equivalent to Global Methane Pledge, reducing methane emissions by 30% (~17 MtCH4) by 2030 | 0. 5 GtCO2e |
| Sector | Ambition | “Prudent” Estimate Assumptions | Mitigation Estimate |
| Renewables | Treble total installed renewables1 capacity from ~3.5 TW up to ~11 TW by 2030 |
|
3.5 GtCO2e |
| Energy Efficiency | Double annual primary energy efficiency gains from ~2% p.a. up to ~4% p.a. by 2030 | Slower progress on energy efficiency, avoiding 20 EJ of fossil fuel demand (~12 EJ of gas, 9 EJ of oil), after accounting for renewables growth under “Prudent” assumptions:
|
2.5 GtCO2e |
| Oil and Gas | Net Zero Scope 1&2 emissions by 2050, near-zero methane and zero routine flaring by 2030. | 40% of oil and gas industry emissions are covered, with companies reducing methane-related emissions by 95% by 2030. | 1 GtCO2e |
| CCS | Aspirational goal for Gt-scale CCS by 2030 | Existing announced project pipeline of ~400 MtCO2 capacity by 2030 gets built | 0.4 GtCO2e |
| Heavy Emitting Sectors | Launch ITA for cement, steel, aluminium, shipping, aviation | Assume only existing pipeline of net-zero projects tracked by Mission Possible Partnership, that are announced or at FID, gets built by 2030. | 0.25 GtCO2e |
| Deforestation | Protect, restore and sustainably manage forest basins in a range of tropical countries | Take lower mitigation potential from deforestation measures included in Roe et al. (2021) for six key example countries: Brasil, Indonesia, PNG, Ghana, DRC, RoC. Reduced further to 0.5 GtCO2e to account for lack of sufficient finance. | 0.5 GtCO2e |
| Agriculture and Food | Range of proposals to accelerate uptake of alternative proteins, fertilizer innovations, dietary shifts, and reductions in agriculture methane emissions |
|
0.7 GtCO2e |
| China Methane | Pledge to include methane mitigation in next NDC | Assume China carries out mitigation in three key areas:
|
0.35 GtCO2e |