

This section highlights key graphs from our analysis, outlining the ETC’s positioning on key sustainability topics. Our charts are one of the many ways our thought leadership shapes debate around the complex subject of the energy transition. The charts below can be found in our latest Insights Briefing, Streamlining Planning and Permitting to Accelerate Wind and Solar Deployment.
Plausible time savings in offshore wind planning and permitting
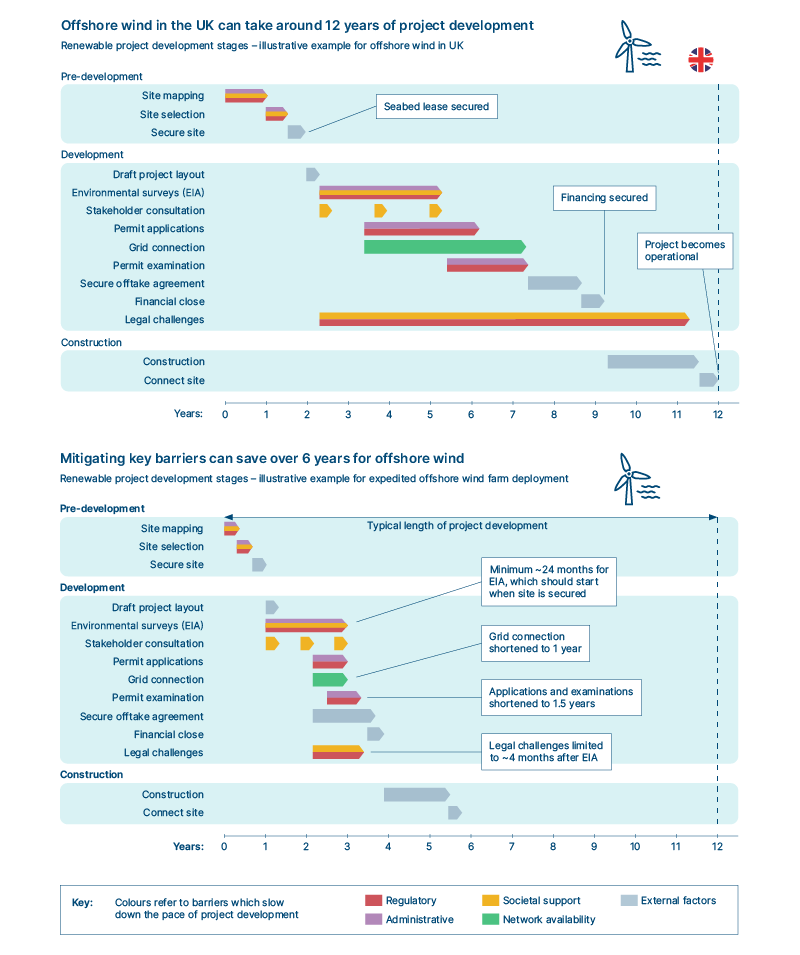
Planning and permitting solutions can have positive effects on almost all stages of project development, reducing development timelines to optimal levels. Though precise savings will vary by project and geography, we identify the key opportunities and minimum timelines for offshore wind to be as follows:
- Site mapping and selection could be reduced by 1 year – For offshore wind farms time savings are limited by the speed at which governments can conduct the mapping of the land and complete the auction process to lease the seabed space.
- Environmental surveys could be reduced by 1.5 years – Surveying bird life, marine life must be considered, and surveys have to take place over water, which further limits time savings.
- Permit applications and examination could be reduced by 2.5 years – For offshore wind, there is sufficient scope to cut permitting times by more than half by implementing best practices (e.g., ensuring developers can have a single point of contact for applications, in departments that are adequately staffed and trained, with clear digital permitting processes). However, offshore permits typically take longer due to project complexity, compared to onshore wind and solar projects.
- Obtaining grid connection could be reduced by 3 years –Grid connection times could be significantly expedited if the grid was built to have excess capacity and transparent connection points.
- Legal challenge window could be shortened by 7.5 years – The window to be legally challenged should start when permit applications begin, be open at least 4 months after submission of an Environmental Impact Assessment (EIA) and should be closed before projects get to financial close to limit disruption.
It is important to note that these barriers and opportunities refer to grid-scale generation technologies, which represent the bulk of capacity required for the clean power scale-up.
If you would like to reproduce this chart, please let us know.
Interested in receiving these insights in your inbox? Click here to sign up for our mailing list.