
Our charts are one of the many ways our thought leadership shapes debate around the complex subject of the energy transition.The chart below can be found in our latest report infographics, Fossil Fuels In Transition.
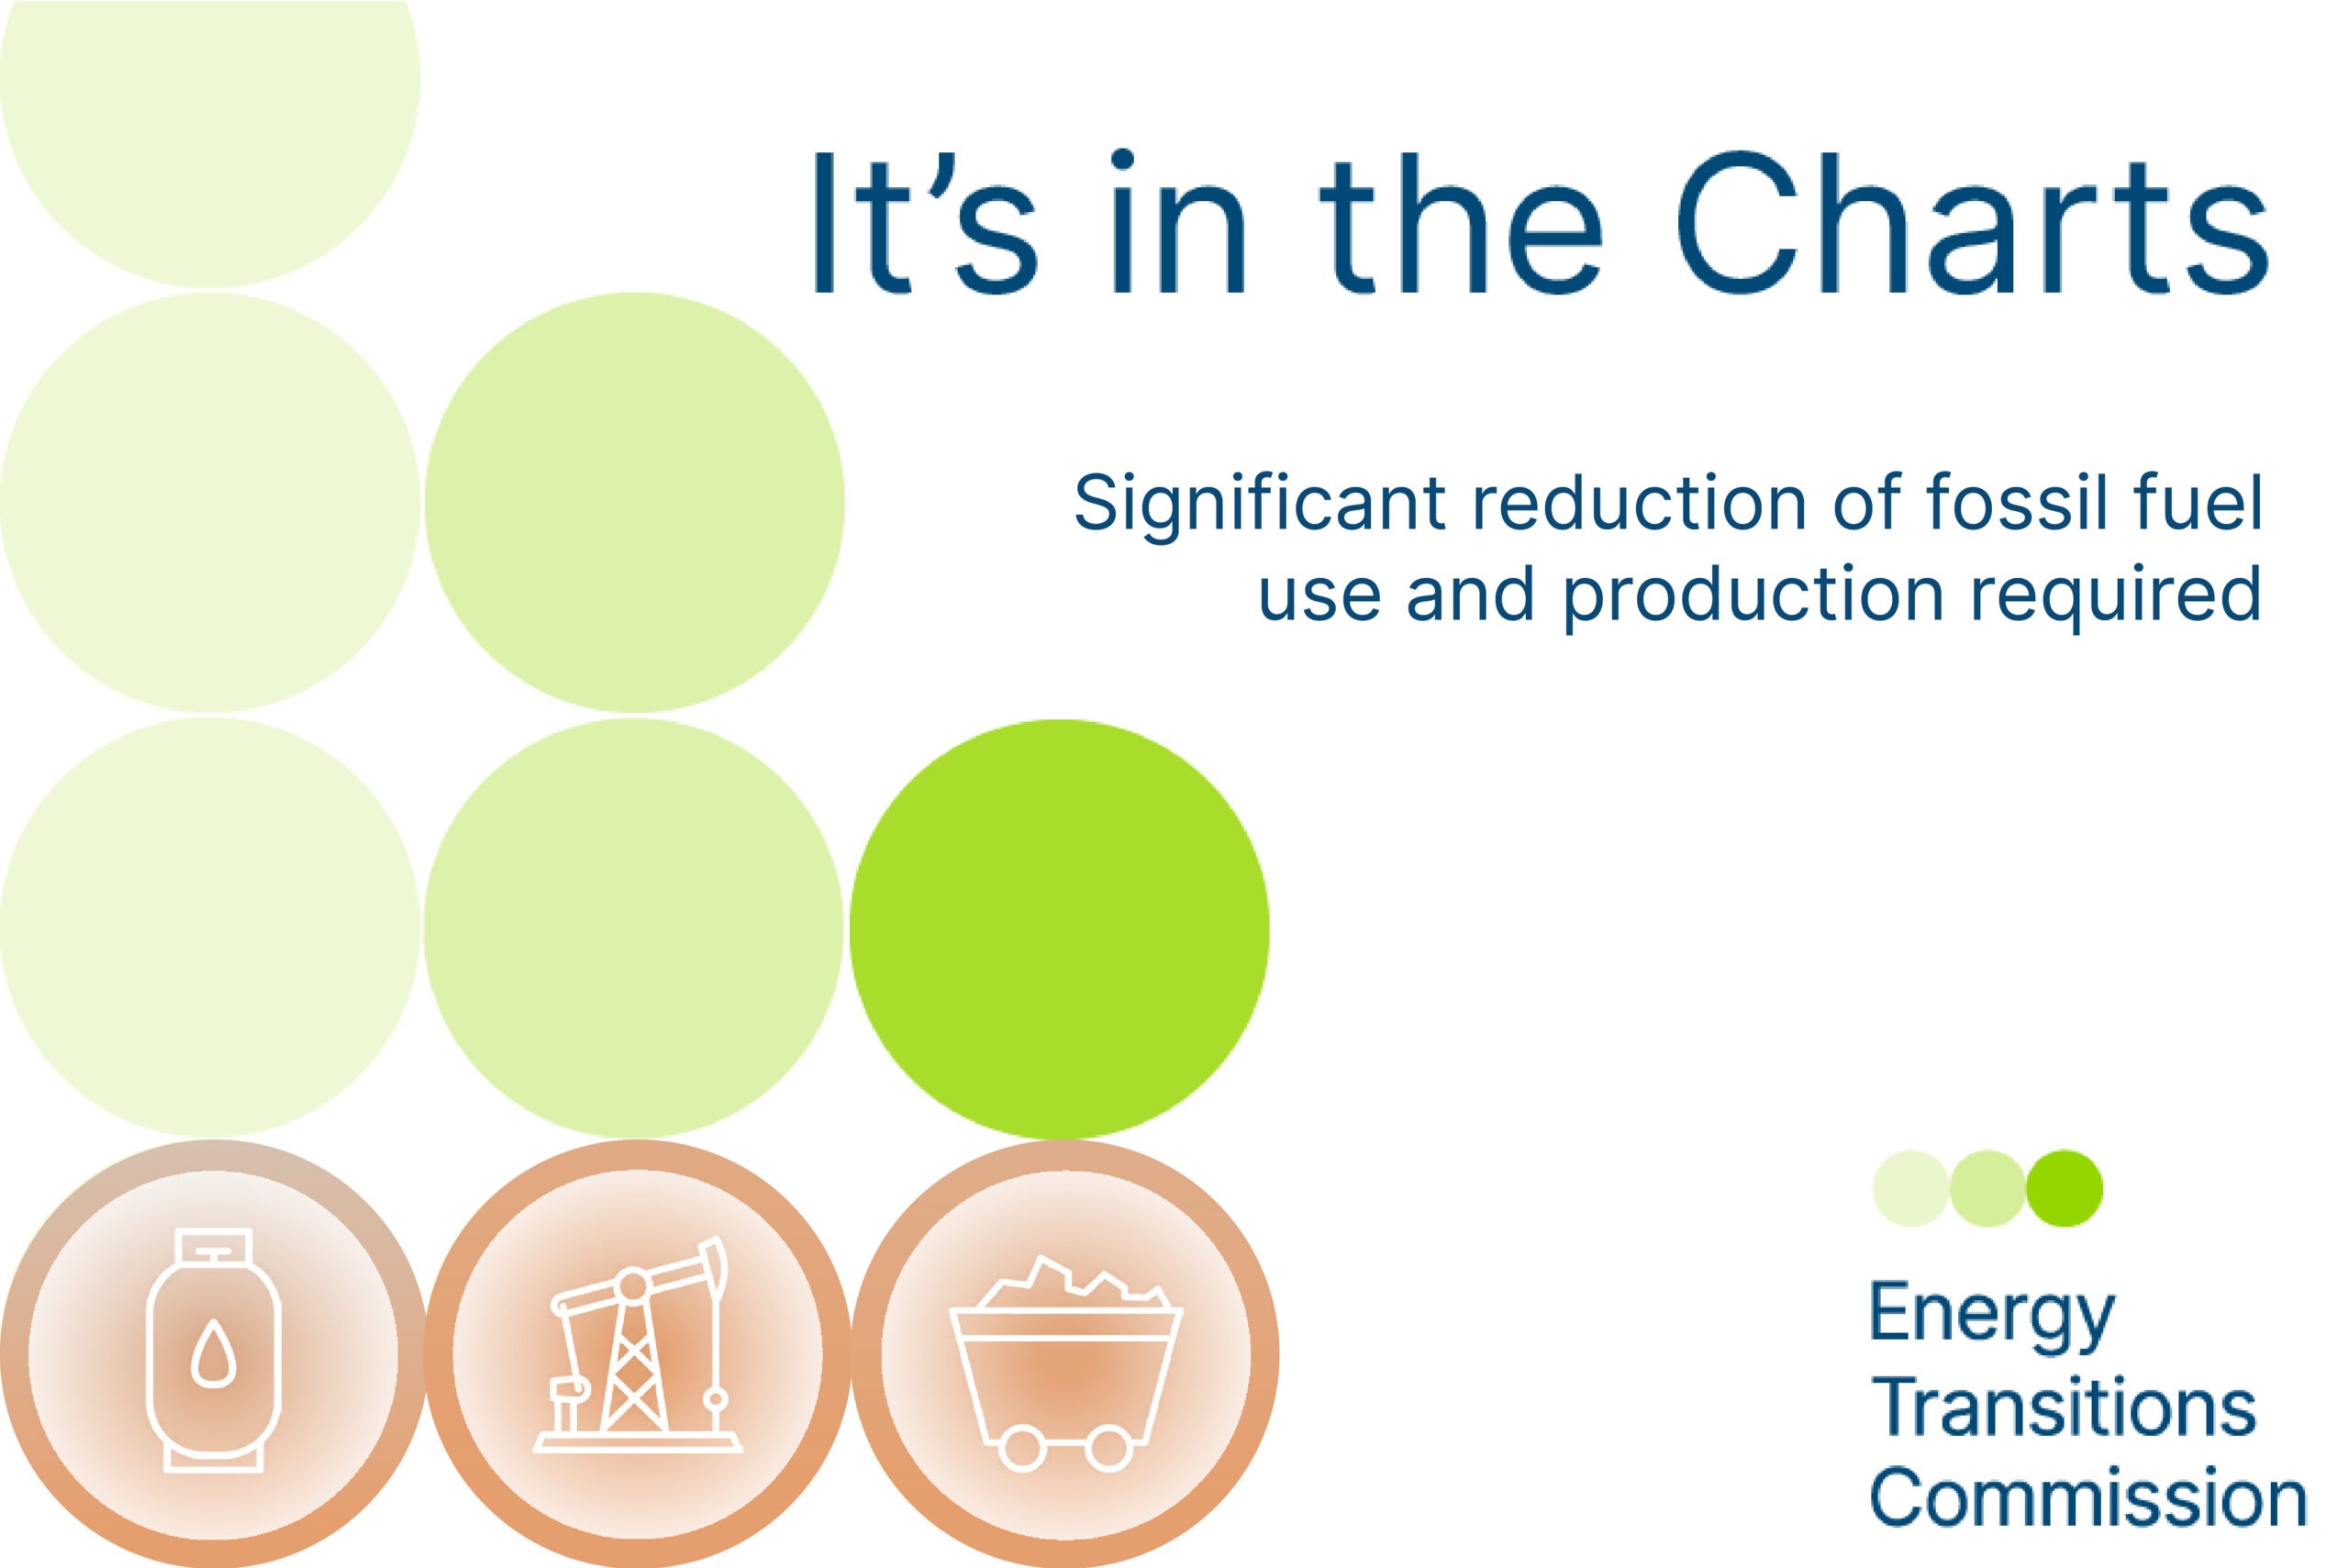
Reducing global emissions requires a significant reduction in fossil fuel use and production
Fossil fuels contribute around 72% of total global greenhouse gas emissions (37.8 GtCO2eq of 52.8 GtCO2eq). Around 6 Gt of these emissions result from the production, transport and processing of coal, oil and gas. In the ETC’s report, we estimate that these “scope 1 and 2 emissions” can and must be reduced by 55% by 2030.
However, the majority (+80%) of fossil-related emissions result from the combustion of fossil fuels in use. Therefore, it is essential to rapidly phase down the demand for and supply of all fossil fuels to reach net-zero emissions levels by mid-century, as set out in the Paris Agreement. This reduction can and must start now, with coal use needing to decrease around 15-30% by 2030, gas by 15-20% and oil by 5-15%.
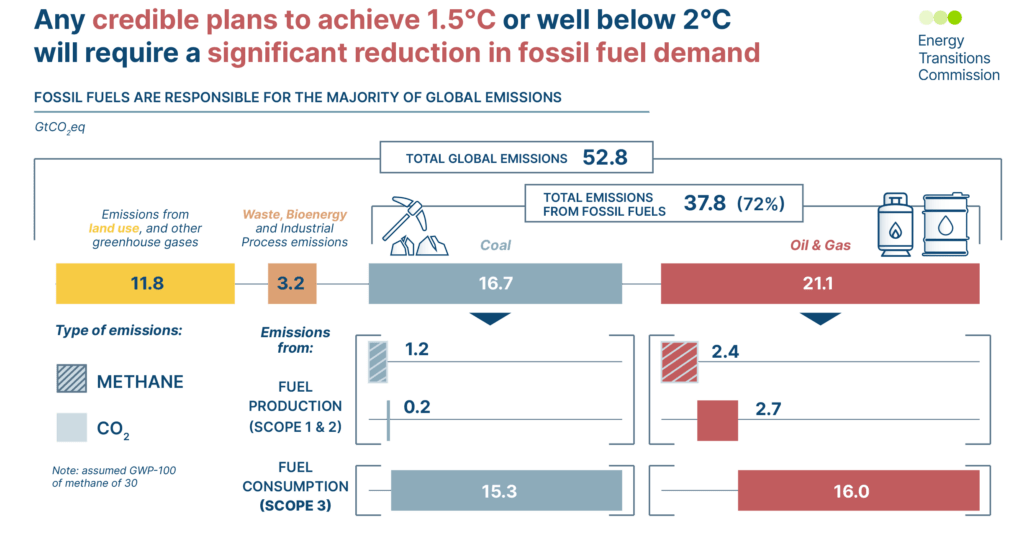
Some emissions will need to be offset by carbon capture and removals, however, there are clear limitations to how fast these solutions can scale up by 2050. This means that the possibility of carbon capture and removals cannot be used to justify business as usual for fossil fuel production. Reducing emissions from the production and use of fossil fuels is essential if the world is to meet climate targets.
This exhibit was published in the ETC’s report Fossil Fuels in Transition: Committing to the phase-down of all fossil fuels
If you would like to reproduce this chart, please let us know.
Interested in receiving these insights in your inbox? Click here to sign up for our mailing list.