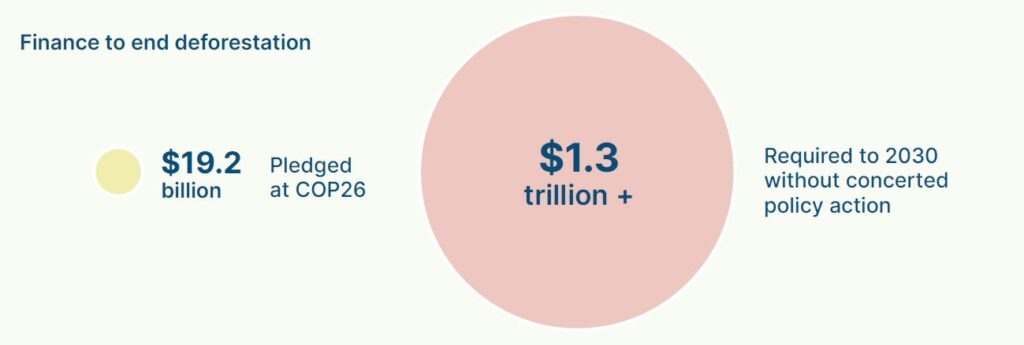
In this ETC chart, we shed light on the upwards trend of emissions related to deforestation year on year and compare the finance pledged at COP26 against the total cost required to end deforestation by 2030 if no concerted action takes place.
Pledges are not enough to end deforestation
Nature-based solutions represent the highest potential for emissions reductions through absorbing CO2, yet emissions from deforestation continue to rise. Despite the ambition shown in agreements at COP26, country actions have faced implementation challenges due to the absence of regulatory intervention and high fragmentation of land ownership. The OPEC forest agreement and potential calls for finance at COP27, alongside the election of President Lula in Brazil, have raised some hope for progress in this area.
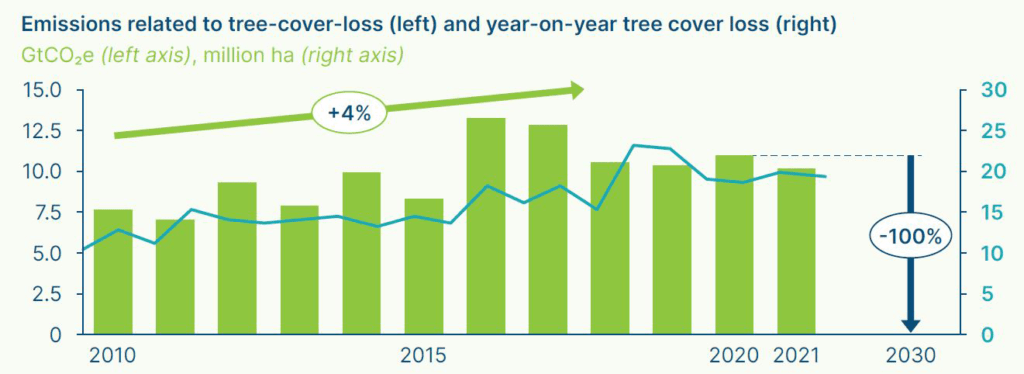
*Note that net emissions from deforestation were ~5 GtCO2e p.a. between 2015-20, after accounting for ~5 GtCO2e p.a. of removals due to forest expansion. Source: ETC (2022) Degree of urgency; Global Forest Watch (2022)
International flows of finance to offset the short-term incentives for deforestation are critical to establishing positive progress in this sector. The ETC’s estimates suggest that if an end to deforestation could be achieved through financial mechanisms alone, it might cost at least $1.3-2.6 trillion to end deforestation by 2030, or $150-300bn a year between now and the end of the decade. These costs reflect the protection of 85-170 Gt of carbon in the trees and soil of forests most at risk from deforestation.
These costs are significantly higher than the $19.2bn that has currently been pledged by developed countries to end deforestation. The ETC’s upcoming report on Financing the Transition will set out our approach to estimating these payments in more detail.
 These charts were published in the ETC’s Degree of Urgency accompanying sector progress scorecard on Nature.
If you would like to reproduce this chart, please let us know.
Interested in receiving these insights in your inbox? Click here to sign up for our mailing list.